Graphing: M&Ms Candy Color Chart
Give students a handful or small bag of M&Ms. Students use the chart to graph the number of M&Ms of each color. Can be used with the preschool lesson M & M Counting Chart.
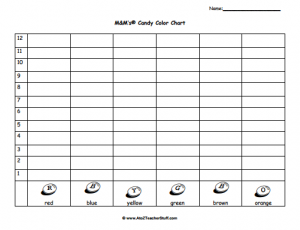
The 1-page chart is a bar graph numbered 1 to 12, with columns for red, blue, yellow, green, brown, and orange and a name line at the top.
Printable M & Ms Candy Color Graph
Ways to use it
- Give each student a handful or small bag of M&Ms to sort by color.
- Have students color one box for each candy to build their bar graph.
- Ask which color has the most, which has the fewest, and how many more.
- Combine everyone’s results into a class graph.
- Pair it with the M & M Counting Chart lesson.
Find More: